

How wet is this wet?
Caroline Pettit, Rangeland Research Officer, Darwin
The 2017/2018 wet season has been one of extremes across the NT with records being broken on either end of the rainfall spectrum from the wettest wets in the Darwin-Daly region to one of the driest on record for parts of the Barkly.
The onset of the monsoon officially started on the Sunday 21 January 2018, the fourth latest on record. The monsoonal onset is usually defined by a reversal of the prevailing winds and widespread heavy rainfall. This is distinct from the Northern Rainfall Onset which is when 50mm of rain has fallen after September 1. This is when pasture growth is expected to start. Despite the late start to the monsoon, most parts of the northern NT received good early rain.
With only one or two official months of wet season remaining the outlook for more rain in the Top End is promising with approximately a 50% chance of exceeding median rainfall. Things are less promising for the hard hit Barkly region with a less than 50% chance of exceeding median rain. This can change with a low pressure system in the right place at the right time but statistically speaking the outlook is not good.
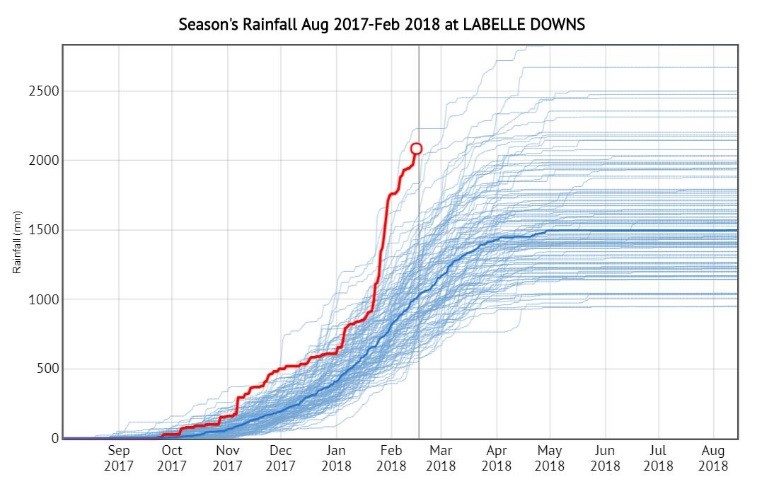
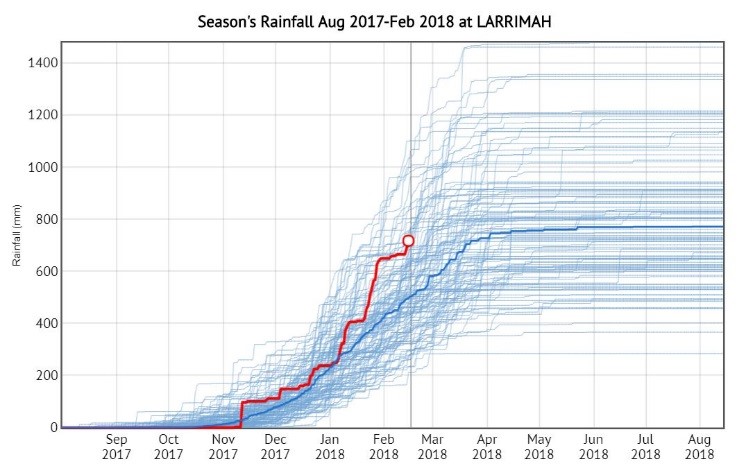
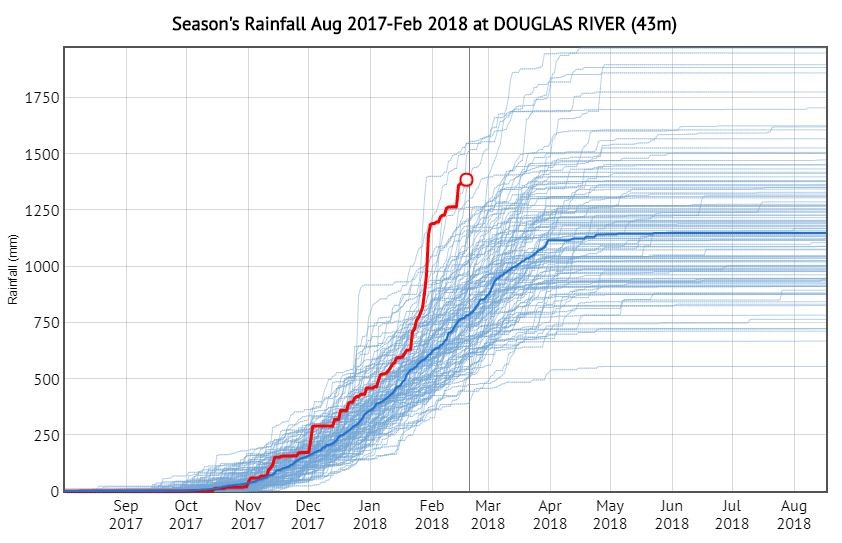
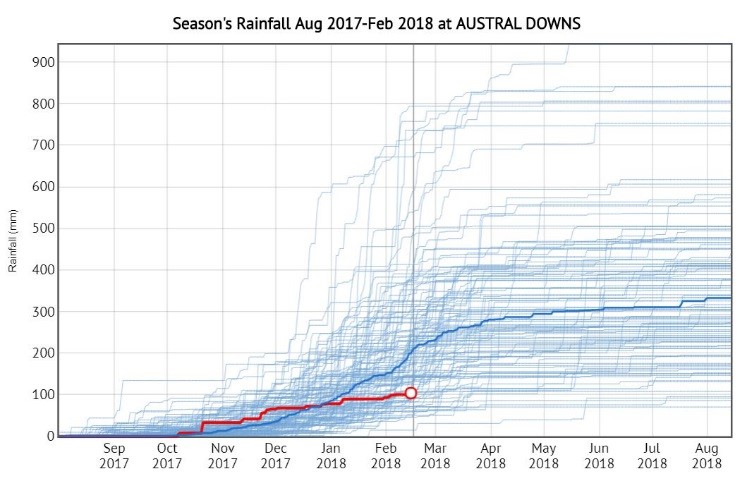
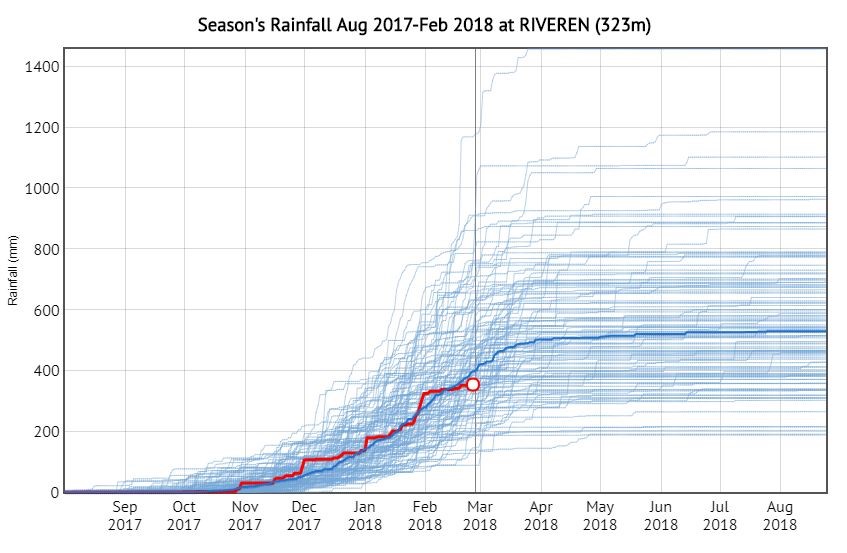
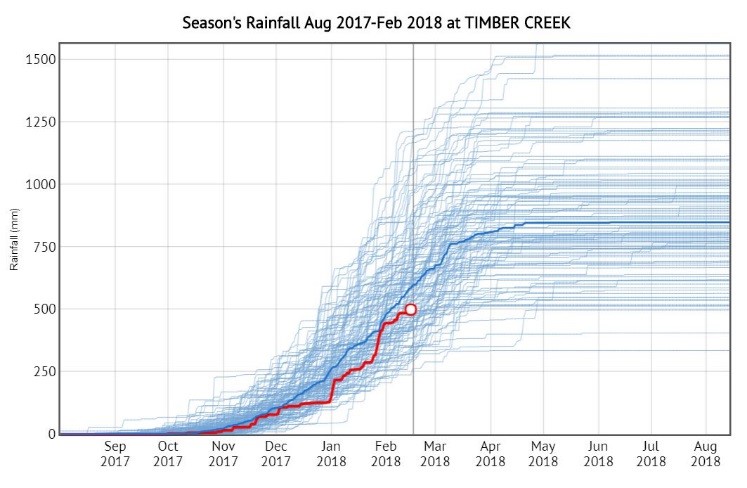
Using the CliMate app the following graphs have been produced to show the cumulative rainfall for this year (red line) and how this compares to historical rainfall (thin blue lines). The median rainfall for each location is shown as a solid blue line.
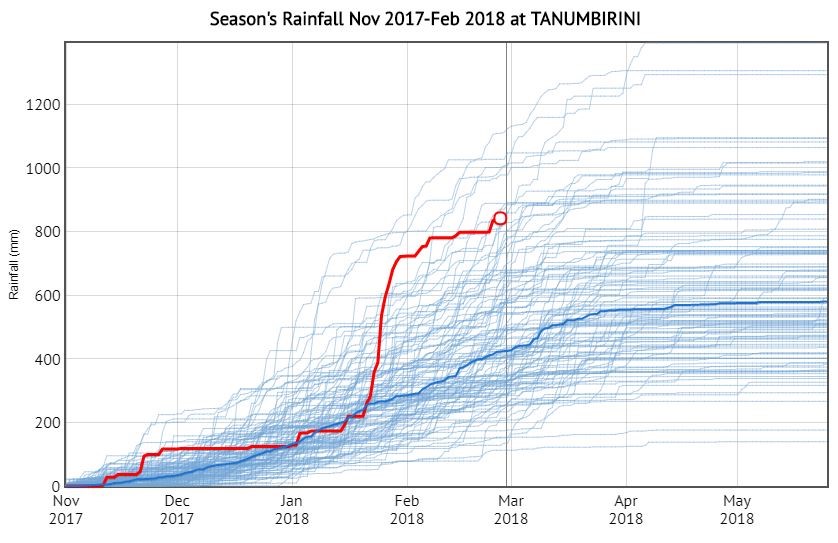
The monsoon in late January brought significant rainfall to parts of the western Top End and Daly regions. Labelle Downs broke its January rainfall record of 807mm when it recorded 1138mm for the month. January records were also broken in Adelaide River Township, Jabiru, Bachelor and Tanumbirini.
| 
|
| Graph 1. Season’s rainfall at Labelle Downs | Graph 2. Season’s rainfall at Tanumbirini |
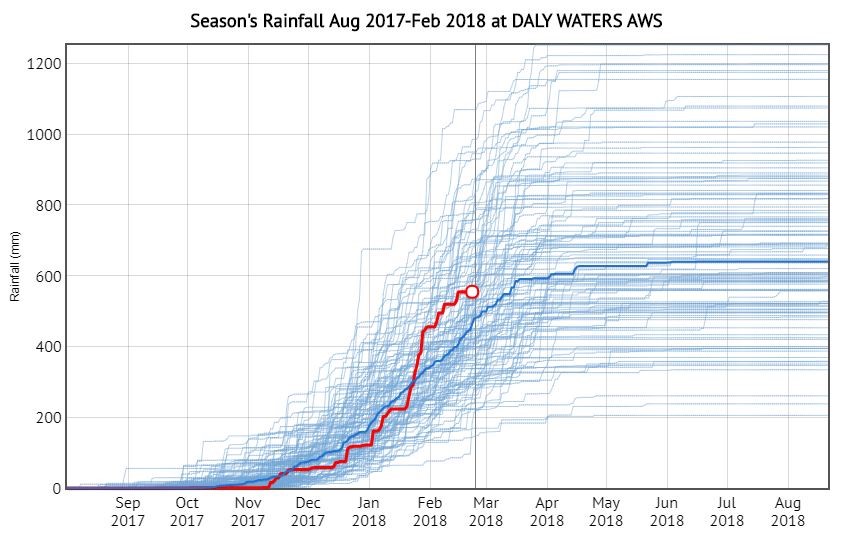
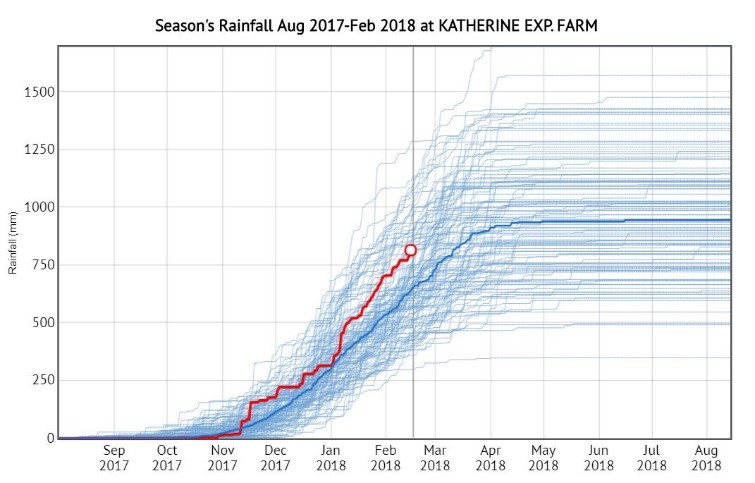
Rainfall in the Katherine and Sturt Plateau region is well above median for this time of year. Frequent storms throughout December and January kept rainfall totals up while most of the region was affected by the strong monsoon in late January. While the season has been good up until the end of February for the region, further rainfall in excess of 100mm will be needed to maintain the above median rainfall totals by the end of the wet season.
| 
|
| Graph 3. Season’s rainfall at Daly Waters AWS | Graph 4. Season’s rainfall at Katherine Exp. Farm |
| 
|
| Graph 5. Season’s rainfall at Larrimah | Graph 6. Season’s rainfall at Douglas River |
Despite good early rainfall in November and December across the Barkly region, a prolonged dry spell during late December and January brought rainfall totals to well below median for this time of year. Some areas of the southern and western VRD are also below median rainfall after a dry February with Riveren receiving only 45mm in February compared to the median monthly rainfall of 132mm. Timber Creek has also experienced a drier than usual wet season with only 50mm of rain in December, well down on the median of 180mm. Despite good January rainfall a relative dry February delivered 50mm less than the monthly median.
Although rainfall is tracking close to the long term average for Riveren and Timber Creek for this time of year, it might feel drier because rainfall in the VRD rain has often been above average over the last 20 years.
| 
|
| Graph 7. Season’s rainfall at Austral Downs | Graph 8. Season’s rainfall at Riveren |
| |
Graph 9. Season’s rainfall at Timber Creek |
In most years, the wet season is over by April. The Bureau of Meteorology are predicting a low chance of receiving the median rainfall between now and May for the Barkly and Southern VRD so these areas need to be prepared for the likelihood of little to no more significant rain.
To see the rainfall outlooks for your area on the Bureau of Meteorology website.
This year, forage budgeting will be critical in areas with less than median rainfall to calculate how much pasture will be available and how to adjust stock numbers accordingly. If stocking rates are not adjusted to available forage, higher utilisation of pasture could lead to a decline in land condition. A decline in land condition during poor years can have a substantial flow-on effect onto future seasons even after good rainfall. For help with forage budgeting and advice on stocking rate adjustments contact Livestock Industries Development on (08) 8999 2014.
Give feedback about this page.
Share this page:
URL copied!