

Data = Fun!
During the recent Alice Springs BeefUp Forum there was discussion about how the pastoral industry can collect and use their own cattle data. One comment that stuck out during this discussion was ‘Data is scary!’
Producers are likely to have many questions about their herd productivity. Where do cattle like to graze, how far cattle roam from a water source, how many calves are being lost between birth and weaning, how many breeders are getting pregnant, what animals should be culled or how much feed is left in the paddock, and so on.
There are a number of companies that have technology available to help you collect the data you need.
Some examples include:
- Cibolabs
- Tru-test
- Gallagher
- Sapien.
If producers are looking at a spreadsheet full of numbers it can lead to sore eyes and headaches.
Before producers start looking at data, it’s important to think about the story or answer you want it to reveal.
Data challenge: choose a story … any subject that interests you
As an example of how this works, Pastoral Technical Officer, Lakota Taber has created a video on how to analyse data. Some of the questions she asked herself before starting were:
- What data do I need to tell the story?
- What data do I already have to help investigate my story?
- How can I use the data I already have?
- Will I need to collect different data next time?
If you want to watch the video, you can find out more about some pre-existing data she used to understand what affects pregnancy rates at the department’s Old Man Plains (OMP) Research Station.
- The story: what affects the pregnancy rate?
- The first question is: has rainfall impacted the pregnancy percentage in the 4 paddock rotation over the past 5 years?
What data do I need to tell the story?
- Pregnancy percentage of the breeders in 4 paddock rotation herd.
- Annual rainfall.
What data do I already have to help investigate my story?
- Pregnancy status of the breeders in the 4 paddock rotation herd.
- Rainfall data from the Bureau of Meteorology (BoM) website.
How can I use the data I already have?
- Start with one year of data at a time.
- Use Excel to sort individual cattle data and separate males from females. Watch our video tutorial for steps 2 to 6.
- Sort the females by pregnancy status.
- Use Excel to count the total number of females.
- Use Excel to count the total pregnant.
- Use Excel to divide the total pregnant females by the total number of females. This will give you the pregnancy percentage.
- Record this number on a different excel sheet next to the relevant year.
- Repeat the previous steps 2 to 7 for the other years.
- Go to the BoM website and download the rainfall data for Alice Springs for the years you have collected pregnancy status data for.
BoM Home > Climate and Past Weather > Weather Station Data > type in location then click Get Data > All years of Data to download folder.
- Use Excel to calculate the total rainfall using the SUM function and record it on a separate sheet (see video tutorial for more details).
- Put the pregnancy percentage data beside the annual rainfall data in a table (example below).
| Year (June to July) | Pregnant (%) | Rainfall (mm) |
|---|---|---|
| 2016/2017 | 96.1% | 284 |
| 2017/2018 | 96.2% | 179.2 |
| 2018/2019 | 90.2% | 131.4 |
| 2019/2020 | 80.8% | 106.8 |
| 2020/2021 | 88.7% | 291.3 |
- Graph the data in a combination graph.
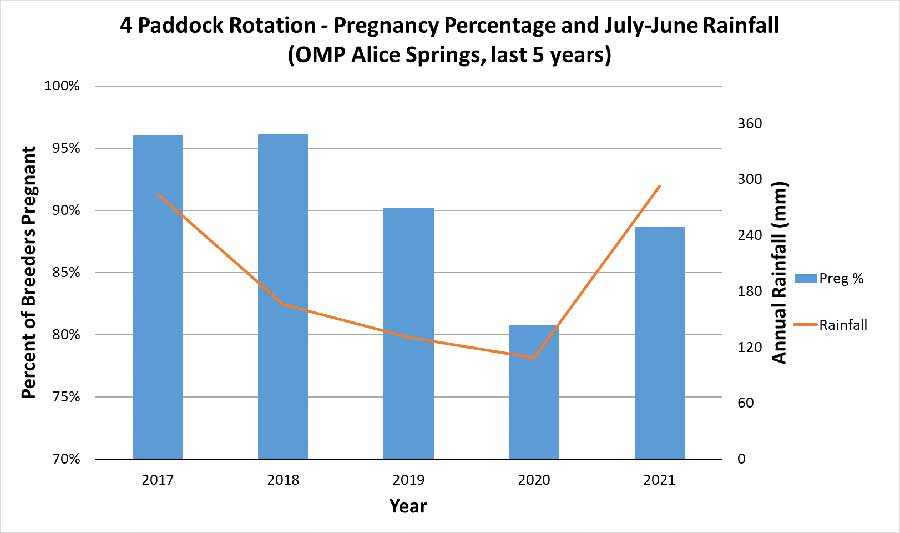
After collating the data from the 4 paddock rotation pregnancy testing with the 12 month rainfall data from 2017 to 2021, the graph shows that pregnancy percentage may be correlated to rain totals. This can be seen as the line showing the 12 month rainfall total follows the same pattern as the percentage of breeders that are pregnant.
It is also important to understand that there are a variety of other factors that will affect data and its output.
Other factors that might have influenced this graph include:
- the condition of animals prior to conception - all of these animals were in a suitable BCS prior to conception
- the amount of feed available in the paddock - all of these animals had adequate feed in the paddock
- the soundness of the bulls - bulls are assessed annually in detail before they are used
- the variability in the accuracy of rectum palpitation to identify a pregnancy.
Disclaimer: This graph shows a snapshot in time and is just an example of how you can collate and present data to tell a story.
This example is pretty straightforward and most producers would expect to see a correlation between pregnancy percentage and rain. Thinking carefully about this data often leads to the next question. Was it the rainfall total or was it the condition of the cows (who hopefully had enough to eat)? This might lead to the next piece of data collection and body condition score could be recorded at the next muster.
It's important for producers to make sure the data they plan to collect will answer the question. Have a clear plan of what aspects of the herd is of most interest, so that when in the yards ready to collect data, the right information is obtained.
Data collection is an important part of any business. Make it count.
Where should I start?
Don’t be afraid to have a go! Start small. Data does not have to be perfect to be useful, just consistently the best you can do. A good place to start might be a herd inventory, for example, working out how many animals are on the property in each age class.
If you would like some help planning data collection then contact Lakota Taber.