

Useful weather forecasts for summer
Alice Springs received above average rainfall for the months of October and November 2020! Yep, you read that correctly. The median rainfall (what you can expect half the time) is 17.1mm for October and 20.1mm for November. Alice Springs Airport received 22.2mm in October 2020 and 39.8mm in November 2020. It’s pretty obvious to everyone that none of this was close to a growth event and after a really long dry spell, small amounts of rain don’t produce anywhere near as much growth as they might in wetter periods.
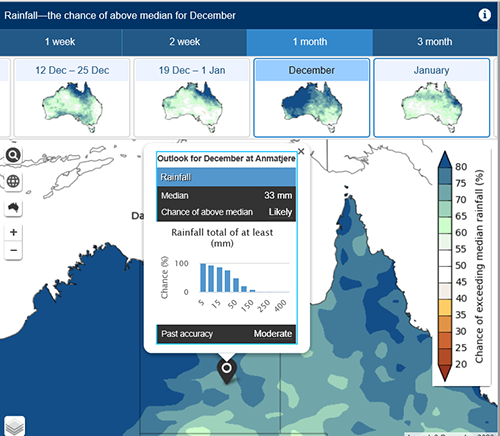
The moral of the story? Make sure you understand what the rain forecasts are telling you. Many climate outlooks tell you the likelihood of exceeding median rainfall. When you use the Bureau of Meteorology (BOM) website, right click on the map to get detailed information on long-term median rainfall for your station (Figure 1). This information is based on data sent in by stations over many, many decades.
What is happening with La Niña?
The BOM declared a La Niña event at the end of September and it is currently forecast to continue until about the end of January 2021. Keep in mind that it is not an on/off switch. This means it is always going to be difficult to predict rain in the middle of a vast, hot country, however, if the ocean conditions are favourable, i.e. close to La Niña conditions, we have an increased chance of getting moisture brought into Central Australia. It is worth noting that not every La Niña event has meant above average rain in Central Australia, however, all of the really wet years (e.g. 1999 to 2000, 2010 to 2012) have been La Niña events.
A really good way to keep track of climate drivers is to subscribe to the BOM’s Weekly Tropical Climate Update.
When will it rain next?
This is often an important question if you are planning on moving or selling stock, or perhaps considering burning some scrubby country. The Madden-Julien Oscillation (MJO) is a climate driver that refers to a pulse of cloudiness that circles the globe every 30 to 60 days. It moves along the equatorial regions eastward from Africa to the Pacific Ocean and can usually be forecast up to two weeks in advance. When the MJO is located to the north of Australia it can lead to increased rainfall in Central Australia. That’s because there is often increased convection and moisture available in the atmosphere and local weather patterns can drag that moisture across the country.
The MJO is almost famous for its spaghetti diagram! But it’s not really that hard to work out. You can see that there are eight triangles representing the eight phases of the MJO. Each phase refers to a location on the globe, with phase 1 being near Africa. Phases 4 and 5 are immediately to the north of Australia (the maritime continent). When the MJO is active in these phases it often drives bursts in monsoon rainfall in the Top End. In addition, tropical cyclones are more likely to form when the MJO is active and both effects can bring rain further south into the middle of the continent.
Figure 2: Madden-Julien Oscillation (MJO) forecast as of the 10th December 2020 www.cpc.ncep.noaa.gov.
Figure 2 shows the forecast diagram from Thursday 10 to Wednesday 23 of December. On the forecast diagram, the red line shows where the MJO was each day of November and the purple line shows where the MJO was in December. The bright green line shows the forecast for the next two weeks. The MJO is considered active, and therefore likely to impact on rainfall, when the line is outside the circle in this diagram. Readers in Central Australia will recall that it did in fact rain quite a bit in the week up to Christmas and the MJO was indeed active in phase 4.
Some producers will use an MJO forecast to make decisions on putting lick out or spraying weeds. Other producers, when making decisions on trucking stock, have used a forecast MJO event as the decision date. If the event passes with little rain and feed is running low, they will move more stock as it is unlikely that there will be rain in the coming month.
Visit the Climate Prediction Centre website for more information on the MJO forecast
Climate forecasts are ‘most likely’ scenarios and there will always be a level of uncertainty in the forecast. Make sure you check the ‘skill level’ for your region on the BOM website for the forecast you are looking at. A lower skill level means more uncertainty. However, if you keep one eye on the climate drivers that affect your region you will have a much better idea of what rainfall is likely and that is better than any crystal ball!
Contact
Alison Kain
Pastoral Production Officer
08 8951 8101