

Climate variability on the Barkly Tableland
For many properties on the Barkly, the failed wet season of 2018/2019 was one of the driest on record. Tennant Creek Airport recorded only 89mm, the driest year since records began in 1970. Brunette Downs Station recorded only 134mm, making it the 3rd driest year in 126 years of recorded rainfall.
Perhaps more importantly, much of the Barkly has experienced 4 consecutive years below the long term average. From a pastoral perspective, it is recognised that pastures need a good wet season to recover from a dry year and for much of the Barkly, it’s been quite a few years since the last good wet season.
So, is this normal for the Barkly?
How would you describe the Barkly’s climate?
The Barkly is described as having a semi-arid monsoonal climate with a wet season that extends from October to March. An early start to the wet season can see useful rain falling in October and November, however it is more common for most of the rain to fall between late December through to February. When we use the term ‘wet season’, many people think of hot weather and reliable summer rain. In reality, the Barkly has a highly variable climate.
What makes the Barkly climate so variable?
Moisture for rain comes from the oceans. By the time it has travelled up to 1,000km over a hot, dry land mass to get to the Barkly, there may not be a lot of moisture left.
The heat from the land and atmosphere, combined with moisture that has made its way from the oceans, creates conditions suitable for convection and isolated thunderstorms. However these isolated storms are highly variable in both rainfall totals and extent.
The best rain often comes when monsoonal troughs extend into the region with widespread, soaking rain. This type of rain can lead to significant growth events and it usually only occurs a couple of times per wet season. There are often long dry periods between these rainfall events.
Growth events rather than a ‘growing season’
Even though we regularly refer to the Barkly wet season, in reality, pasture growth is typically generated from isolated rainfall events rather than a season of reliable and regular rain.
There have been quite a few studies that have identified that a minimum of 50mm of rain is required to initiate a pasture growth event on the Barkly (Bastin 2014; Phelps 2014). Growth events might be initiated by a one day or a multi-day rain event but the important point is that soil moisture levels have to be kept high enough for long enough to allow for germination and seedling establishment. The soil moisture must also be deep enough for plants to achieve substantial growth that creates a good feed base as well as seed production.
The Bureau of Meteorology (BOM) also defines a useful rain event (comparable with a growth event) as being at least 50mm over a single or multi-day period. Tennant Creek township has a long rainfall record which makes it useful for analysing trends in rainfall patterns. In most years, Tennant Creek is likely to get 2 growth events between December and February. However, between 1900 and 2019 there were 18 wet seasons that did not experience a growth event. That works out to 1 in every 7 years, which isn’t particularly rare. At the wetter end of the record, there have been 3 wet seasons that have recorded 6 growth events between October and March.
Growth events are critical management periods because they represent the best opportunity to maximise pasture growth and ensure forage availability through the next dry season.
The BOM has put together an interesting summary of the Barkly climate which you can find at BOM's Regional Weather and Climate Guide . The Northern Australia Climate Program have also published a useful guide to interpreting forecasts to assist with management decisions: Climate savvy for grazing management: Barkly Tablelands & Alice Regions
Geographical variation
It makes sense that the northern parts of the Barkly receive more rainfall than the southern areas. After all, they are closer to the moisture source. Looking at long-term rainfall records shows a decline in rainfall totals from the northern Newcastle Waters Station, to Brunette Downs Station in the central Barkly and Kurundi Station south of Tennant Creek (Figure 1).
| Location | Average rainfall Jul-Jun (mm) | Median rainfall Jul-Jun (mm) | Years of data (may be incomplete) |
|---|---|---|---|
| Newcastle Waters | 503 | 468 | 1889-2020 |
| Brunette Downs | 416 | 362 | 1891-2020 |
| Kurundi | 367 | 333 | 1934-2020 |
The Barkly, particularly in the southern parts, can also experience winter rain which further adds to climate variability. This is often the case in years when the Indian Ocean Dipole (IOD) is in its negative phase.
It is worth noting that the BOM issued a statement on the 20th July that a negative IOD has become established and is likely to be active until about November 2021. A negative IOD increases the potential for moisture to be carried into the central regions of the continent during the late dry season and early wet season and could promote an early start to the northern wet season.
So what is normal?
Using average rainfall figures is commonplace but it is perhaps not the best measurement for working out what is ‘normal’. Firstly, let’s think about how averages are calculated - by adding together the annual rain totals from multiple years and then dividing by the number of years (the average is also called the mean rainfall). Also, we are not using calendar years to do that for the Barkly. Using financial years conveniently groups each wet season in one ‘year’.
Another useful measure is to calculate the median. Median rainfall is worked out by ranking all data (listing in order) from the driest year to the wettest year. The point in the middle is the median. In dry environments like the Barkly, the really wet years make the mean higher than the median. It is also useful to think about how we use these measures of rainfall to guide what we expect in a typical year. When we talk about ‘average rainfall’, there is a tendency to consider that to be normal – something that we get most of the time – but that’s not really correct. Even the median rainfall is only likely to be exceeded in half of the years. By definition there will be just as many years that receive less than the median.
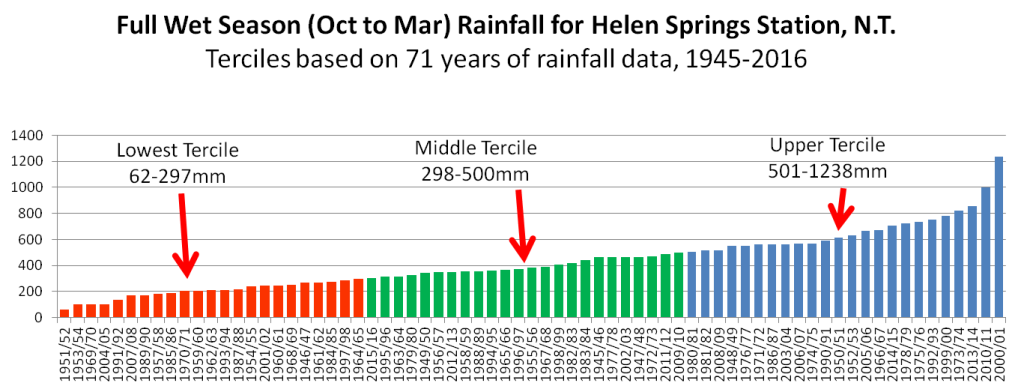
Many producers find the tercile to be a more useful description of ‘normal’ rainfall. Terciles are worked out by ranking all data from the driest to the wettest year and dividing them into 3 even sections. Using terciles helps describe a ‘dry’ year, based on the rainfall range of the driest tercile, and a ‘wet’ year, based on the wettest tercile. It is tempting to consider the middle tercile as representing ‘normal’ years, but a more cautious interpretation may be appropriate.
Figure 2 shows 71 years of data from a Barkly property ranked from driest on record to wettest on record. A wet season total anywhere from 298mm to 500mm would be in the middle tercile. Rather than considering that a normal year, producers may want to focus on how often they can expect rainfall in that range to occur, which is about one year in three. Likewise, describing a year as “below average” could be mentally calibrated by remembering that half of all years will have less than the median rainfall and more than half will have less than the average.
Intra-season variability
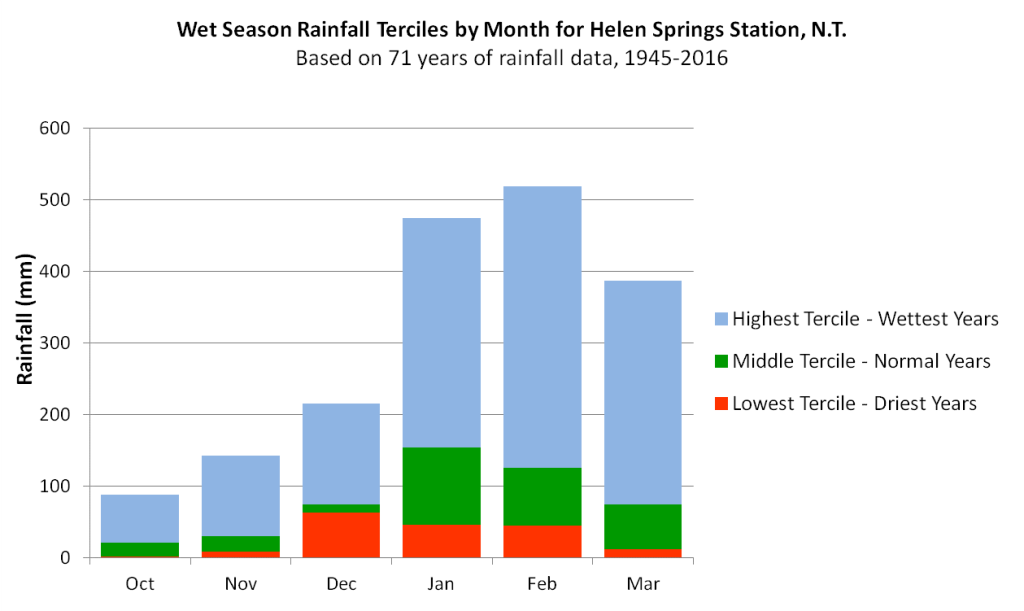
Even within a wet season, there is a lot of variation about when most of the rain falls. Will it be early or late (or will there be a long break in between rain events)? Long-term data is really useful for getting a realistic picture of what you can expect. Figure 3 shows monthly rainfall for Helen Springs. The total for each month is colour coded for terciles, with orange showing the driest third of years and the green blocks showing the middle third of records. The blue years show us the wettest third of records, and the blue blocks are the biggest for each month, which relates to the high level of variability within the wettest range. They are so large because they include the rare, really wet events.
The tricky thing for human memory is that those are the years we remember the best and because we recall them easily, we are inclined to think of them as more ‘normal’ than they really are. This graph shows us that while big rainfall events can occur during any month of the wet season, the Barkly is most likely to get rain in January and February. It also shows us that each wet season month will have less than 50mm of rain in 33% of years, which could mean no, or only poor growth events.
A wetter trend
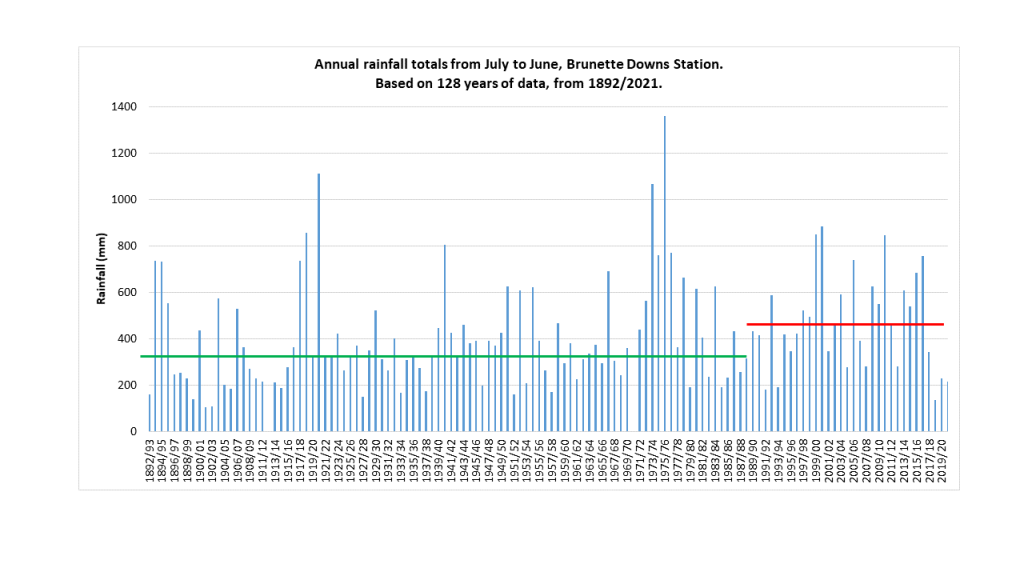
Since 1990, the Barkly has experienced a much wetter period than the long-term rainfall records would suggest is normal. This factor alone has perhaps made 4 consecutive dry years even more challenging. Such an extended run of dry years wasn’t uncommon 50 to 100 years ago but, in the last 30 years, there have been more regular occurrences of wet years.
While recent years have been very dry (the wet season of 2018/2019 was the driest on record for Tennant Creek and the third driest on record for Newcastle Waters and Brunette Downs), the wetter trend of the last 30 years is illustrated in Figure 4. The median July to June rainfall for Brunette Downs Station from 1990 to 2020 was 464mm, quite a bit more than the median of 335mm for the years 1891 to 1989! Unfortunately, no one knows if the climate will stay wetter or whether the recent decades have been a bit unusual. The Barkly has had many dry years in the past and there is no indication that they won’t return.
In a nutshell, there is a lot of variability within a Barkly wet season and between seasons. The recent decades of increased rainfall may be a trend that will continue but it could well be another feature of the Barkly’s variability. Understanding the variability in the historical records can help producers and decision makers build resilience into their systems for the dry years.
What about the wet season of 2021/22?
The good news is that the global climate models are suggesting that the remainder of 2021 might be wetter than normal. At the end of July, the Bureau of Meteorology indicated a 65-70% chance of an early start to the coming wet season. This forecast is updated fortnightly on their website.
With the establishment of a negative Indian Ocean Dipole (IOD) at the end of July, it is likely that there will be more moisture available for local weather systems to tap into. In the next few months we will also get a clearer picture of conditions in the Pacific Ocean. At this stage the models are tending slightly towards another weak La Niña which also increases the likelihood of wetter conditions around the beginning of the wet season. It’s good to know that these climate drivers don’t operate like an on/off switch. The closer we get to a La Niña or a negative IOD, the more likely we are to get rain. Here’s hoping that the wet season of 2021/22 breaks the recent trend of drier seasons.
Bibliography
Bastin G (2014) Australian rangelands and climate change – heatwaves. Ninti One Limited and CSIRO, Alice Springs.
Phelps, D.G. and Houston, I. (2014). "A guide to the recovery of Mitchell grass". North Sydney, Meat and Livestock Australia.