

The Madden-Julien Oscillation for beginners
The Madden-Julien Oscillation (MJO) is a key climate driver for Northern Australia. Although it receives far less media attention than its cousin, the El Niño Southern Oscillation (El Niño/La Niña), the MJO plays a more significant role in determining the quality of the northern wet season.
The diagram below shows the area of Australia directly impacted by the MJO and the period in which it is active (October to April with the most impact being felt between late December and March).
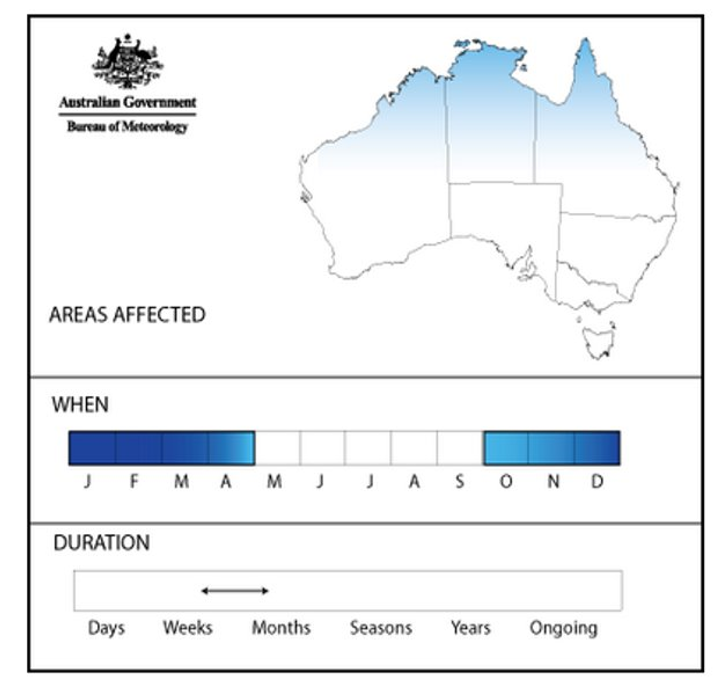
Image source: Bureau of Meterology
What is the MJO?
The MJO is a pulse of cloud and rainfall that travels around the globe from west to east, close to the equator. It can take between 30 and 60 days to complete its circuit. Depending on where it is located, the MJO can increase the chance of rainfall but can also decrease the chance of receiving rain, effectively increasing the likelihood of sunny conditions.
Active in summer, the MJO coincides with the northern wet season. The MJO is largely responsible for determining the timing of rain within the wet season, that is, why some periods are wetter or drier than others.
How can we track it?
The Bureau of Meteorology (BoM) tracks the progress of the MJO and this information can be found on the BOM website
Figure 1. MJO track for January to March 2013
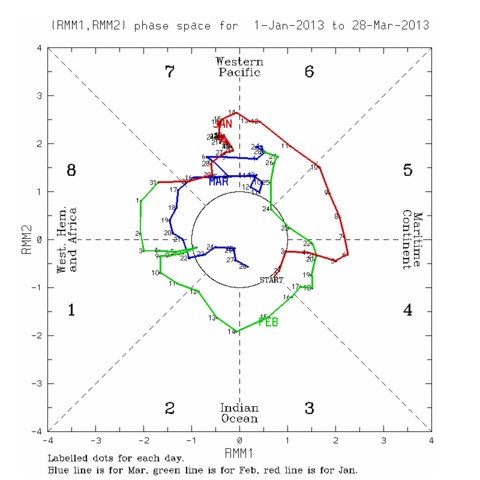
Image source: Bureau of Meterology
While MJO charts look confusing at first glance, it is fairly easy to read once you know what you are looking at. The coloured lines track the physical location of the MJO on its journey around the globe. The different colours signify the different months. In Figure X, the red line represents January, the green line is February and the blue line is March. The numbers beside each line are the dates within the month.
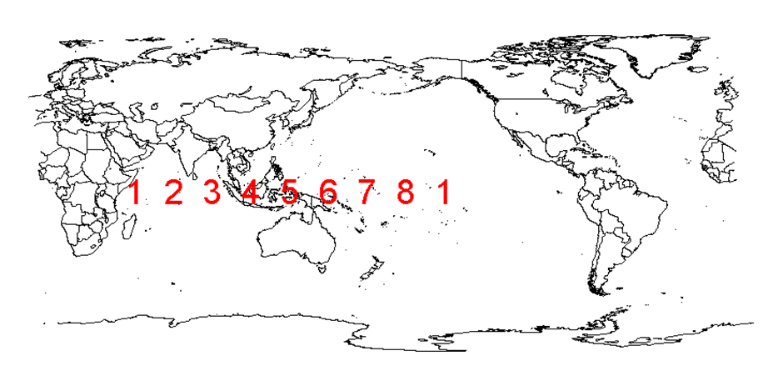
The numbered sections one to eight represent a geographic location in relation to the earth’s surface. Figure XX shows how these numbered sections correspond to the physical location of the MJO.
Figure 2. Map of MJO locations
The MJO‘s strength can be determined by the distance between the tracking line and the circle in the centre of the plot. The further the line is from the circle, the stronger the MJO signal. When the line is inside the circle, the MJO is very weak to indiscernible and its effect on our weather is lessened.
What does this mean for me?
When the MJO is in sections four, five and six there is an increased chance of rainfall in northern Australia. When the MJO is sections eight, one and two there is a decreased chance of rainfall. Sections two and seven are neutral in terms of rainfall.
The ability to predict the MJO’s progress and strength has improved in recent years and BoM incorporates this information into its seasonal forecasts.
MJO and cyclones
Cyclones are still very much a wild card and can occur anywhere at any time. Although they are notoriously hard to predict, observations suggest that cyclones are more likely to generate out of the tail of the MJO, rather than the lead.
A short video with more explanation about the MJO (and other important climate drivers) can be found at the Climate Kelpie website
No results were found