

Pastoral Market Update - June 2020
Download PDF version of newsletter PDF (309.5 KB)
Live Exports via Darwin Port
Notes:
- Figures are for stock exported through the Port of Darwin only; some NT stock are exported through interstate ports.
- The NT Cattle figures here have been rounded respectively and may not tally to totals.
The figures listed below are correct as at 30 June 2020 and are subject to change as further data becomes available.
| Destination | Export of ALL CATTLE (including interstate) | Export of NT CATTLE (estimate only) | ||||||||||||
|---|---|---|---|---|---|---|---|---|---|---|---|---|---|---|
| 2018 | 2019 | Last year to 30/06/19 | YTD to 30/06/20 | June | Last month | Difference | 2018 | 2019 | Last year to 30/06/19 | YTD to 30/06/20 | June | Last month | Difference | |
| Brunei | 3,653 | 5,021 | 1,958 | 3,215 | 0 | 550 | -550 | 2,292 | 3,504 | 1,453 | 2,339 | 0 | 461 | -461 |
| Indonesia | 328,724 | 300,527 | 141,616 | 161,819 | 36,099 | 34,706 | 1,393 | 217,944 | 201,946 | 100,373 | 123,899 | 28,877 | 29,100 | -223 |
| Philippines | 10,482 | 14,345 | 9,844 | 7,515 | 2,941 | 1,435 | 1,506 | 7,262 | 10,019 | 7,271 | 5,661 | 2,353 | 1,203 | 1,149 |
| Sabah | 0 | 0 | 0 | 0 | 0 | 0 | 0 | 0 | 0 | 0 | 0 | 0 | 0 | 0 |
| Sarawak | 2,106 | 2,693 | 1,227 | 1,000 | 0 | 1,000 | -1,000 | 1,631 | 1,920 | 900 | 838 | 0 | 838 | -838 |
| Malaysia | 11,813 | 8,364 | 6,638 | 0 | 0 | 0 | 0 | 7,848 | 6,001 | 4,834 | 0 | 0 | 0 | 0 |
| Vietnam | 49,771 | 48,159 | 27,137 | 23,246 | 4,324 | 10,145 | -5,821 | 35,342 | 32,164 | 19,071 | 17,764 | 3,459 | 8,506 | -5,047 |
| Egypt | 0 | 0 | 0 | 0 | 0 | 0 | 0 | 0 | 0 | 0 | 0 | 0 | 0 | 0 |
| Thailand | 1,720 | 0 | 0 | 0 | 0 | 0 | 0 | 1,274 | 0 | 0 | 0 | 0 | 0 | 0 |
| Cambodia | 0 | 0 | 0 | 0 | 0 | 0 | 0 | 0 | 0 | 0 | 0 | 0 | 0 | 0 |
| TOTAL | 408,269 | 379,109 | 188,420 | 196,795 | 43,364 | 47,836 | -4,472 | 273,592 | 255,555 | 133,903 | 150,501 | 34,689 | 40,109 | -5,420 |
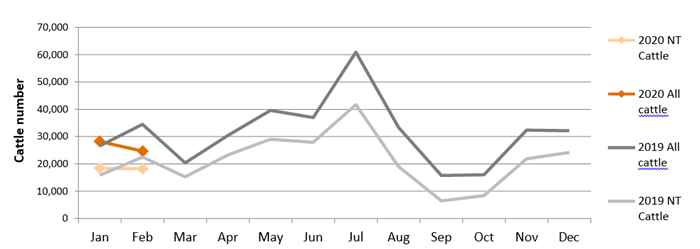
Live cattle exports through Port of Darwin
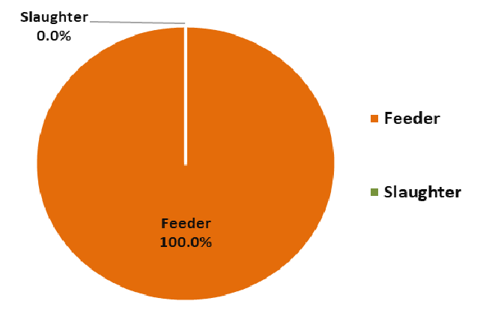
Live cattle and buffalo exports by type
Other livestock 2020
| Destination | Buffalo | Goat | Camel | |||
|---|---|---|---|---|---|---|
| YTD | June | YTD | June | YTD | June | |
| Brunei | 0 | 0 | 0 | 0 | 0 | 0 |
| Indonesia | 2,865 | 1,137 | 0 | 0 | 0 | 0 |
| Philippines | 0 | 0 | 0 | 0 | 0 | 0 |
| Sabah | 0 | 0 | 0 | 0 | 0 | 0 |
| Sarawak | 0 | 0 | 0 | 0 | 0 | 0 |
| Malaysia | 0 | 0 | 0 | 0 | 0 | 0 |
| Vietnam | 312 | 0 | 0 | 0 | 0 | 0 |
| Egypt | 0 | 0 | 0 | 0 | 0 | 0 |
| Thailand | 0 | 0 | 0 | 0 | 0 | 0 |
| Cambodia | 0 | 0 | 0 | 0 | 0 | 0 |
| TOTAL | 3,177 | 1,137 | 0 | 0 | 0 | 0 |
Livestock movement statistics
Reports for livestock movements from NT to Interstate, within NT and Interstate to NT are updated biannually and available from the department's website.
| Total of all cattle through Port of Darwin | Total of all NT cattle through Port of Darwin | ||||||||||||
|---|---|---|---|---|---|---|---|---|---|---|---|---|---|
| 2013 | 2014 | 2015 | 2016 | 2017 | 2018 | 2019 | 2013 | 2014 | 2015 | 2016 | 2017 | 2018 | 2019 |
| 359,616 | 536,803 | 510,860 | 372,251 | 308,845 | 408,269 | 379,109 | 308,784 | 295,738 | 324,477 | 236,511 | 190,715 | 273,592 | 255,555 |
Subscribe or unsubscribe to the monthly Pastoral Market Update.
Prepared by NT Department of Primary Industry and Resources. For further information contact PMU@nt.gov.au. Disclaimer: While DPIR exercises care in the compilation and preparation of this information, no responsibility is taken for its accuracy or for the completeness of any information that is reproduced from other sources. DPIR denies any loss or damage to any person whether caused directly or indirectly by the use of any of the information provided.
Give feedback about this page.
Share this page:
URL copied!