

Pastoral Market Update - February 2024
Download PDF version of newsletter PDF (158.2 KB)
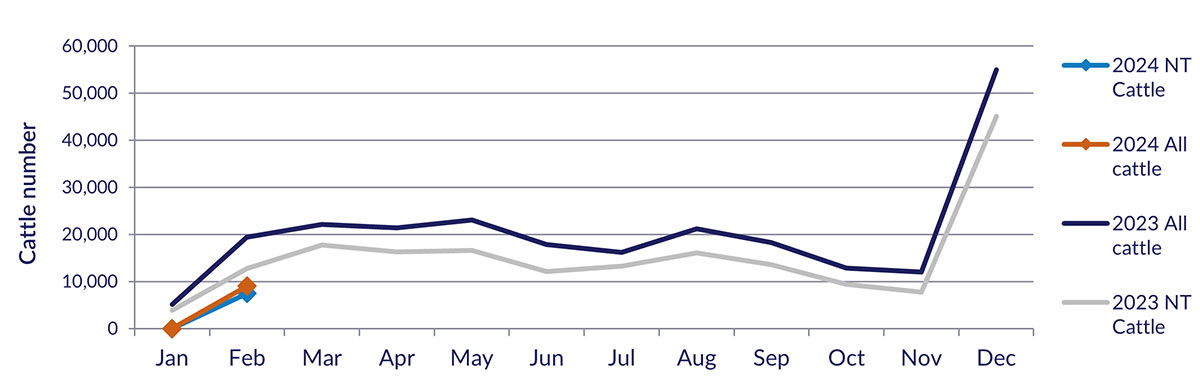
Live exports via Darwin Port
Notes:
- Figures are for stock exported through the Port of Darwin only; some NT stock are exported through interstate ports.
- The Northern Territory cattle figures here have been rounded respectively and may not tally to totals.
The figures listed below are correct as at 29 February 2024 and are subject to change as further data becomes available.
| Destination | Export of ALL CATTLE (including interstate) | Export of NT CATTLE (estimate only) | ||||||||||||
|---|---|---|---|---|---|---|---|---|---|---|---|---|---|---|
| 2022 | 2023 | Last year to | YTD to | Feb | Last month | Difference | 2022 | 2023 | Last year to | YTD to | Feb | Last month | Difference | |
| 1/02/23 | 1/02/24 | 1/02/23 | 1/02/24 | |||||||||||
| Brunei | 2,722 | 3,282 | 0 | 819 | 819 | 0 | 819 | 2,205 | 2,448 | 0 | 681 | 681 | 0 | 681 |
| Indonesia | 203,381 | 213,805 | 17,958 | 5,907 | 5,907 | 0 | 5,907 | 160,123 | 162,126 | 11,745 | 4,909 | 4,909 | 0 | 4,909 |
| Philippines | 4,348 | 7,495 | 1,472 | 2,282 | 2,282 | 0 | 2,282 | 3,413 | 5,554 | 963 | 1,896 | 1,896 | 0 | 1,896 |
| Sabah | 2,667 | 950 | 0 | 0 | 0 | 0 | 0 | 2,069 | 724 | 0 | 0 | 0 | 0 | 0 |
| Sarawak | 1,248 | 1,840 | 0 | 0 | 0 | 0 | 0 | 914 | 1,258 | 0 | 0 | 0 | 0 | 0 |
| Malaysia | 2,416 | 4,326 | 0 | 0 | 0 | 0 | 0 | 1,936 | 3,221 | 0 | 0 | 0 | 0 | 0 |
| Vietnam | 8,993 | 12,737 | 0 | 0 | 0 | 0 | 0 | 7,822 | 9,266 | 0 | 0 | 0 | 0 | 0 |
| Egypt | 0 | 0 | 0 | 0 | 0 | 0 | 0 | 0 | 0 | 0 | 0 | 0 | 0 | 0 |
| Thailand | 0 | 0 | 0 | 0 | 0 | 0 | 0 | 0 | 0 | 0 | 0 | 0 | 0 | 0 |
| Cambodia | 0 | 0 | 0 | 0 | 0 | 0 | 0 | 0 | 0 | 0 | 0 | 0 | 0 | 0 |
| Total | 225,775 | 244,435 | 19,430 | 9,008 | 9,008 | 0 | 9,008 | 178,482 | 184,597 | 12,707 | 7,486 | 7,486 | 0 | 7,486 |
Live cattle exports through Port of Darwin
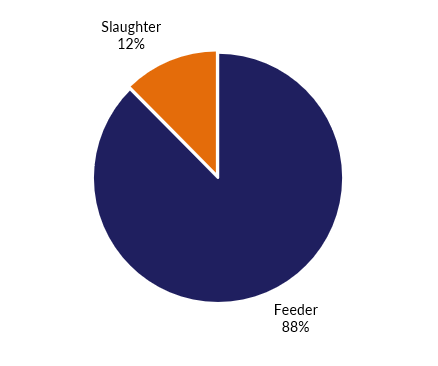
Live cattle and buffalo exports by type
Other livestock 2024
| Destination | Buffalo | Goat | Camel | |||
|---|---|---|---|---|---|---|
| YTD | Feb | YTD | Feb | YTD | Feb | |
| Brunei | 342 | 342 | 0 | 0 | 0 | 0 |
| Indonesia | 0 | 0 | 0 | 0 | 0 | 0 |
| Philippines | 0 | 0 | 0 | 0 | 0 | 0 |
| Sabah | 0 | 0 | 0 | 0 | 0 | 0 |
| Sarawak | 0 | 0 | 0 | 0 | 0 | 0 |
| Malaysia | 0 | 0 | 0 | 0 | 0 | 0 |
| Vietnam | 0 | 0 | 0 | 0 | 0 | 0 |
| Egypt | 0 | 0 | 0 | 0 | 0 | 0 |
| Thailand | 0 | 0 | 0 | 0 | 0 | 0 |
| Cambodia | 0 | 0 | 0 | 0 | 0 | 0 |
| Total | 342 | 342 | 0 | 0 | 0 | 0 |
Livestock movement statistics
Reports for livestock movements from NT to Interstate, within NT and Interstate to NT are updated biannually - see livestock movement statistics.
Total of all cattle through Port of Darwin
| 2017 | 2018 | 2019 | 2020 | 2021 | 2022 | 2023 | |
|---|---|---|---|---|---|---|---|
| 308,845 | 408,269 | 379,109 | 355,355 | 283,461 | 225,775 | 244,435 | |
Total of all NT cattle through Port of Darwin
| 2017 | 2018 | 2019 | 2020 | 2021 | 2022 | 2023 |
|---|---|---|---|---|---|---|
| 190,715 | 273,592 | 255,555 | 271,367 | 235,106 | 178,482 | 184,597 |
Subscribe or unsubscribe to the monthly Pastoral Market Update.
For further information, email the Pastoral Market Update pmu@nt.gov.au.
Disclaimer: The Northern Territory of Australia exercised due care and skill to ensure that at the time of publication the information contained in this publication is true and correct. However, it is not intended to be relied on as professional advice or used for commercial purposes. The Territory gives no warranty or assurances as to the accuracy of the information contained in the publication and to the maximum extent permitted by law accepts no direct or indirect liability for reliance on its content.
Give feedback about this page.
Share this page:
URL copied!