

Primary industry and fisheries sectors
Livestock – cattle
The live cattle export trade (mainly to Indonesia) and interstate movements (mostly to Queensland and South Australia) dominates agricultural production in the Territory. Market destinations for Territory cattle in 2018‑19 consisted of live export trade (33.3 per cent), interstate movements (66.2 per cent) and local slaughter (0.5 per cent).
The pastoral industry is a major contributor to incomes in regional areas of the Territory. It also generates considerable flow‑on benefits to other industries, particularly transport and storage, business‑to‑business services and retail trade services. The pastoral industry contributed 65 per cent of the total value of Territory primary industry and fisheries production in 2018‑19 (Figure 3).
The estimated value of production for the cattle industry in 2018‑19 was $823.5 million, up 36.2 per cent from 2017‑18. In 2018‑19, 794,784 head of Territory cattle were turned‑off for exports, interstate movements or for slaughter, up 41.2 per cent from 2017‑18 (Table 7). Turn‑off for slaughter fell significantly in 2018‑19 to reflect the August 2018 operational suspension of the Australian Agricultural Company’s Livingstone Beef processing facility.
Table 7: Territory cattle industry – turn‑off and production values annual percentage changes
| Turn‑off (Territory cattle only) | 2017‑18 | 2018‑19 | Annual change | |||
|---|---|---|---|---|---|---|
| Head | $M | Head | $M | Head | $M | |
| Interstate movements | 243,501 | $261.6 | 265,007 | $274.5 | 8.8% | 4.9% |
| Live exports | 286,721 | $308.0 | 525,861 | $544.7 | 83.4% | 76.9% |
| Slaughter (Territory abattoirs) | 32,501 | $34.9 | 4,131 | $4.3 | ‑87.3% | ‑87.7% |
| Total | 562,723 | $604.4 | 794,999 | $823.5 | 41.3% | 36.2% |
Source: Department of Industry, Tourism and Trade data collections.
Interstate cattle movements
The majority of Territory cattle movements interstate (Table 8) are slaughter cattle for boxed beef sale in domestic and international markets, such as Japan, South Korea, the United States and Taiwan. Traditionally, over 50 per cent of the interstate movement of Territory cattle goes to Queensland and approximately 20 per cent to South Australia. Western Australia, New South Wales and Victoria account for the remaining 30 per cent of interstate movements.
The value of the total interstate movements of Territory cattle in 2018‑19 was estimated at $544.7 million, up 76.9 per cent from 2017‑18 ($308 million). A total of 525,861 head of Territory cattle were sent interstate in 2018‑19, an 83.4 per cent increase over 2017‑18 (286,721). This increased turn‑off was due to destocking by several of the corporate pastoralists moving cattle to their Queensland properties or selling down to reduce numbers due to dry conditions in the Barkly and Victoria River District.
Table 8: Interstate cattle movements – turn‑off and production values annual percentage changes
| Description | 2017‑18 | 2018‑19 | Annual change | |||
|---|---|---|---|---|---|---|
| Head | $M | Head | $M | Head | $M | |
| Queensland | 161,990 | $174.0 | 382,363 | $396.1 | 136.0% | 127.6% |
| South Australia | 61,748 | $66.3 | 61,546 | $63.7 | ‑0.3% | ‑3.9% |
| Western Australia | 30,922 | $33.2 | 42,331 | $43.8 | 36.9% | 32.0% |
| Other states | 32,061 | $34.4 | 39,621 | $41.0 | 23.6% | 19.2% |
| Total | 286,721 | $308.0 | 525,861 | $544.7 | 83.4% | 76.9% |
Source: Department of Industry, Tourism and Trade data collections.
Live cattle exports
A total of 265,007 head of Territory cattle were exported to South East Asia in 2018‑19 (Table 9), an 8.8 per cent increase over 2017‑18 (243,501 head). The value of production for Territory live cattle exports in 2018‑19 was estimated at $274.5 million, a 4.9 per cent increase over 2017‑18 ($261.6 million).
Indonesia is the largest export market for Territory cattle, accounting for 79.4 per cent of cattle exports through the Port of Darwin in 2018‑19. Vietnam is the next biggest market, accounting for over 13 per cent of exports. Other markets for Territory cattle include Brunei, Malaysia, the Philippines and Thailand. In 2018‑19, Territory cattle exports accounted for 20.3 per cent of Australia’s total live cattle exports and 31 per cent of Australia’s total live cattle exports to Indonesia.
Table 9: Territory live cattle exports – turn‑off and production values annual percentage changes
| Description | 2017-18 | 2018-19 | Annual change | |||
|---|---|---|---|---|---|---|
| Head | $M | Head | $M | Head | $M | |
| Brunei | 2,836 | $3.0 | 2,129 | $2.2 | ‑24.9% | ‑27.6% |
| Indonesia | 187,023 | $200.9 | 210,294 | $217.8 | 12.4% | 8.4% |
| Philippines | 4,579 | $4.9 | 9,953 | $10.3 | 0.0% | 0.0% |
| Sabah | 1,680 | $1.8 | 0 | $0.0 | 0.0% | 0.0% |
| Sarawak | 1,970 | $2.1 | 1,567 | $1.6 | ‑20.4% | ‑23.3% |
| West Malaysia | 12,137 | $13.0 | 6,075 | $6.3 | ‑49.9% | ‑51.7% |
| Thailand | 658 | $0.7 | 616 | $0.6 | ‑6.3% | ‑9.7% |
| Vietnam | 32,617 | $35.0 | 34,372 | $35.6 | 5.4% | 1.6% |
| Total | 243,501 | $261.6 | 265,007 | $274.5 | 8.8% | 4.9% |
Note: Live cattle exports only represent Territory cattle shipped from the Port of Darwin.
Source: Department of Industry, Tourism and Trade data collections
The economies of the major destination countries for live cattle exports are being impacted by the pandemic and the necessary protection measures are severely affecting their economic activity. This will affect household spending. As a result of the pandemic, the global economy is projected to contract sharply by ‑3 per cent in 2020, much worse than during the 2008‑09 financial crisis. In a baseline scenario, which assumes that the pandemic fades in the second half of 2020 and containment efforts can be gradually unwound, the global economy is projected to grow by 5.8 per cent in 2021 as economic activity normalises, helped by policy support.
Figure 6: GDP growth forecasts 2017‑2021f for Territory live cattle exports – major destinations
f: forecast
Source: International Monetary Fund, World Economic Outlook Database, April 2019.
Other livestock
Other livestock is a category of industries in the Territory that has historically included crocodiles, poultry, buffalo, horses, camels, deer, pigs and goats, exported overseas or sent to domestic markets. Crocodiles are the largest industry in this category. Premium grade crocodile skins are highly sought after in Japan, France, Italy and Asian countries. Second and third grade skins are also exported, although there is a growing domestic demand. The by‑products of flesh, feet, teeth and skulls are mainly sold domestically.
Total other livestock (crocodiles, buffalo, horses, camels, pigs, and goats) contributed 2.7 per cent to the total value of Territory primary industry and fisheries production in 2018‑19 (Figure 3).
In 2018‑19, the total value of production in other livestock increased 3 per cent to an estimated $33.8 million, from $32.9 million in 2017‑18 (Table 10).
For 2018‑19, the value of the Territory’s crocodile industry was estimated at $26.8 million. This accounted for 79.3 per cent of the total value of production of the other livestock industry sector.
Buffalo turn‑off decreased 26.2 per cent in 2018‑19 to 7,820 head with an estimated value of $6.6 million.
Table 10: Other Territory livestock industry – production values annual percentage changes.
| Description | 2017-18 ($M) | 2018-19 ($M) | Annual change |
|---|---|---|---|
| Crocodiles | $23.7 | $26.8 | 13.3% |
| Other livestock | $0.20 | $0.39 | 90.7% |
| Buffalo | $9.0 | $6.6 | ‑26.2% |
| Total | $32.9 | $33.8 | 3.0% |
Source: Department of Industry, Tourism and Trade data collections.
Plant industry
The Territory’s plant industry includes:
- fruits
- vegetables
- nursery, cut flowers and turf
- field crops
- Territory markets
- forestry
- other crops.
The value of Territory plant production for 2018‑19 was $288.8 million, an increase of 0.9 per cent compared to 2017‑18 (Table 11). Plant industry (horticulture and mixed farming) contributed an estimated 19.8 per cent of the total value of Territory primary industry and fisheries production in 2018‑19 (Figure 3).
Almost all production from Territory plant industry is sent interstate (for domestic consumption or to be exported). Less than 1 per cent of plant produce is exported directly from the Territory. Historically, this has involved mangoes, melons and pumpkins to Singapore and, most recently, woodchips to Japan. Field crops are mostly hay production for the cattle industry. In 2018‑19, the Territory accounted for 1.7 per cent of national horticulture production.
Table 11: Territory plant industry – production values annual percentage changes
| Description | 2017‑18 ($M) | 2018‑19 ($M) | Annual change | Total production value 2018‑19 |
|---|---|---|---|---|
| Fruits | $181.2 | $185.2 | 2.2% | 64.1% |
| Vegetables | $43.9 | $41.3 | ‑5.9% | 14.3% |
| Field crops | $20.5 | $27.0 | 31.9% | 9.3% |
| Nursery, cut flowers and turf | $17.7 | $15.5 | ‑12.4% | 5.4% |
| Territory markets | $14.8 | $10.6 | ‑28.5% | 3.7% |
| Forestry | $8.2 | $9.2 | 12.2% | 3.2% |
| Total | $286.3 | $288.8 | 0.9% | 100.0% |
Source: NT Farmers Association, NT Farming Production 2018.
Fruits
The main fruits produced in the Territory include mangoes, melons, and table grapes. Fruit production value in 2018‑19 increased an estimated 2.2 per cent to $185.2 million on 2017‑18 (Table 12). This was due to increases in the value for melon and other fruits, offset by a decline in mangoes. There was no production recorded for bananas and table grapes production value was consolidated with other fruits in 2018‑19.
Table 12: Territory fruits – tonnes and production values annual percentage changes
| 2017‑18 | 2018‑19 | Annual change | ||||
|---|---|---|---|---|---|---|
| Description | Tonnes | $M | Tonnes | $M | Tonnes | $M |
| Mangoes | 39,700 | $112.8 | 32,900 | $108.7 | ‑17.1% | ‑3.6% |
| Table grapes | 1,950 | $8.7 | ‑ | ‑ | ‑ | ‑ |
| Melons | 46,000 | $42.0 | 64,400 | $57.4 | 40.0% | 36.7% |
| Other fruits | 4,500 | $17.7 | 6,320 | $19.1 | 40.4% | 7.9% |
| Total | 92,150 | $181.2 | 103,620 | $185.2 | 12.4% | 2.2% |
Source: NT Farmers Association, NT Farming Production 2018.
Vegetables
The major vegetables produced in the Territory include cucumber, bitter melon, hairy melon, long melon, okra, snake beans and pumpkin. Data is not collected for individual commodities.
The production value of vegetables fell 5.9 per cent in 2018‑19 to $41.3 million. Vegetable production was 13,200 tonnes for this period.
Field crops
Historically, Territory mixed farming has included seed production, sorghum, maize and other crops, such as sesame and soybeans. Hay and fodder production, used to supply the Territory cattle industry, accounted for 100 per cent of the total field crops production values in 2018‑19.
Mixed farming contributed over 3 per cent of the total value of Territory primary industry and fisheries production in 2018‑19 (Figure 3).
The value of field crop production in 2018‑19 was $27 million, a 31.9 per cent increase from 2017‑18 ($20.5million).
Territory markets
Local markets accounted for around $9.2 million of production in 2018‑19, mainly in the Darwin markets. Local farmers’ markets include Rapid Creek, Palmerston, Parap, Nightcliff and Mindil Beach.
The major supermarket chains use local production where possible, especially bananas, mangoes, rockmelons, watermelons, Lebanese cucumber, Asian vegetables, pineapples, papaya, dragon fruit, rambutan, carambola and pumpkin. The Territory has specialist vegetable producers supplying hydroponic fancy lettuce, tomatoes and other vegetables to local supermarkets.
Forestry
There are more than 49,000 hectares under plantation forestry across the Territory.
Acacia (Acacia mangium) plantations on the Tiwi Islands are grown for paper pulp.
Tiwi plantations started to reach maturity in 2015 and trees continue to be harvested and sold into the international woodchip market (mainly Japan). In 2018‑19, Tiwi Plantations Corporation exported woodchips worth $10.6 million.
African mahogany is grown for high‑value timber in the Douglas‑Daly and Katherine regions. The trees have an expected rotation of between 18 and 25 years. These plantations are currently mid‑rotation and have been independently valued at $100 million standing value, that is, the current value of trees within the plantation that will yield saleable timber when harvested at maturity.
Indian sandalwood is grown for oil and pharmaceuticals in the Douglas‑Daly and Katherine regions. Sandalwood is the only plantation forestry in Australia routinely grown in a mixed species system and with irrigation. Still at the early rotation phase, Territory sandalwood plantations will not be harvested for more than a decade, when they are expected to go into the valuable international oils and pharmaceutical markets. A standing value is not currently available.
Fisheries
The Territory fishing industry encompasses the commercial, recreational and traditional Aboriginal sectors. The commercial sector includes wild capture and aquaculture production, as well as seafood processing, wholesale, and retail trade.
Most Territory seafood is transported interstate (to be either exported or consumed domestically). The value of Territory fisheries production for 2018‑19 was $119.8 million, an increase of 8.3 per cent compared to 2017‑18 (Table 13). This increase is attributed to a $15.8 million rise in aquaculture output.
This increase was offset by decreases in fish (wild‑stock catch), Territory crustaceans, molluscs and echinoderms and NPF crustaceans (Territory catch). In 2018‑19, fisheries contributed an estimated 9.6 per cent of the total value of Territory primary industry and fisheries production value (Figure 3).
Table 13: Territory fisheries – production values annual percentage changes
| Description | 2017‑18 ($M) | 2018‑19 ($M) | Annual change |
|---|---|---|---|
| Fish (wild‑stock catch) | $37.5 | $33.6 | ‑10.5% |
| Territory crustaceans | $9.8 | $8.7 | ‑11.6% |
| Aquaculture | $25.6 | $41.4 | 62.0% |
| Molluscs and echinoderms | $0.51 | $0.50 | ‑2.9% |
| Total Territory fisheries | $73.4 | $84.1 | 14.6% |
| NPF crustaceans (Territory catch) | $37.2 | $35.7 | ‑4.1% |
| Total fisheries | $110.6 | $119.8 | 8.4% |
Source: Department of Industry, Tourism and Trade data collections.
Northern Prawn Fleet Fishery management area
The Northern Prawn Fleet Fishery management area is located off Australia’s northern coast from Cape York in Queensland to Cape Londonderry in Western Australia. There are 52 vessels licensed to operate within the fishery, which covers approximately 880,000 square kilometres of Australia’s northern waters. On average, the value of the NPF catch accounts for 40 per cent of the total value of Territory fisheries.
Within this fishery, arrangements exist between the Australian Government and governments of Western Australia, the Territory and Queensland, whereby the coastal waters of these states and territories are deemed part of the Australian Fishing Zone. The area of the fishery is sourced from the Northern Prawn Fishery Management Plan 1995 (17 October 2003 – amendments up to Northern Prawn Fishery Amendment Plan 2003 (No NPF 04)). The maritime zone boundaries shown on Figure 7 are sourced from the Australian Maritime Boundaries Information System 2001 (Version 1.1) (released October 2001).
Figure 7: Northern Prawn Fleet Fishery management area
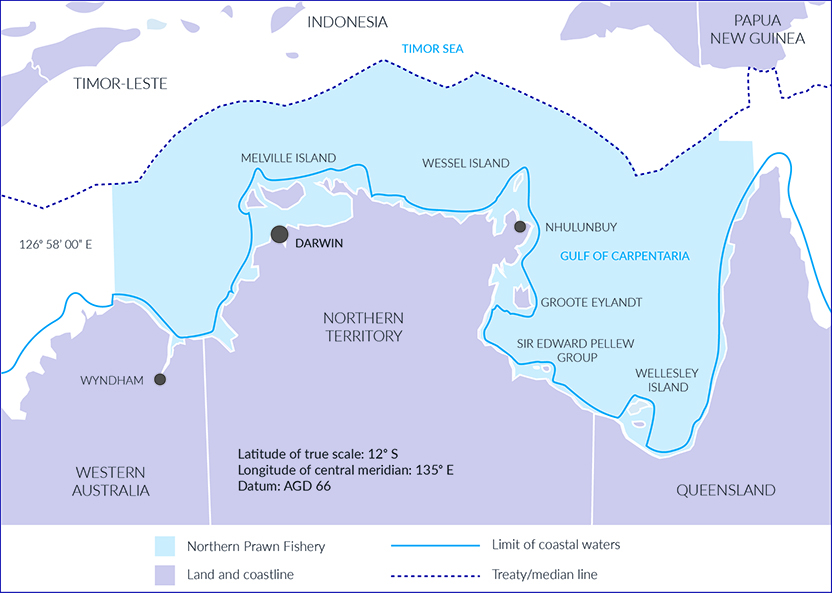
Source: Northern Prawn Fishery Report
Give feedback about this page.
Share this page:
URL copied!